There are 3 methods I see frequently used when creating visualizations in Power BI. I would stick to a file or spreadsheet for prototyping, but diffintely move to Analysis Service for the database in a enterprise. Even if someone says this is a one off, try to move to a centralized database for your company.
The first is a text file or Excel worksheet. The data is already in the rows and columns needed for a report someone else has created. Now, the reporting needs to be ported to Power BI and made ‘pretty’. There might be some ‘cleaning’ of the data, but the basic stuff is setup for the report.

The data here is flattened where the Sales per Year are pivoted into the table with the attributes Country/region, Brand and Months are imcluded. Very simple to start doing visualizations. The figure above shows the columns Sales 2013, Sales 2014, Sales 2015 and Budget.
The next is connecting directly to tables and joining them in a data model. This saves the data model into the Power BI report. The next Power BI report will have to have the same modeling usually with more or less tables/columns along with calculated Measures.

The report writing individuals have to know how relationships are managed between tables. After this skill is mastered, they then have to be able to pivot the data or create measures with DAX. DAX is the measure and caculated column syntax used in power BI. it is also used in Analysis Service Tabular Models.

You also have to make a decision of importing the data or using a Live Connection with all these methods. That decision depends on if the data has to be refreshed and how frequently.

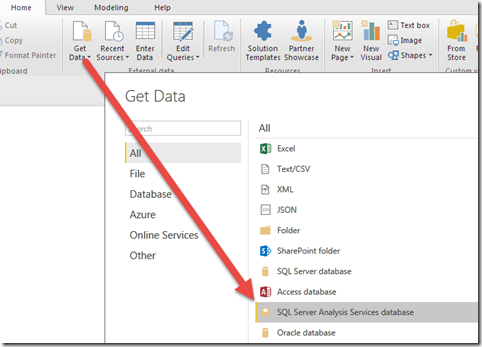
The optimal connection, in my opinion, is an Analysis Service database. Here we are using the Tabular Model, but Multidimensional Cubes can be used.

Here, the business rules, measures and relatinoships are managed in the database and the report writer does not need to have the skills to manage this development. As you can see below, the tables are not listed when selecting the database, just the model or perspective.

The report writer also might be the architect of the Analysis Service database, but it could be someone else. The relationships are built and measures created in the database. This eliminates the problem with measures in the Power BI report.

If you are using Power BI for data modeling, I suggest you try to move to using Analysis Service Tabular Model for an enterprise database solution. Try not to tie up the model and measures in each Power BI report created.

