Microsoft has added a great feature for Copilot in a deployed Power BI report to visualize the output and get more analysis. First, you would need Build permission on the semantic model plus access to copilot in Power BI (https://www.techtarget.com/searchdatamanagement/tip/How-to-use-Microsoft-Copilot-in-Power-BI).
Here is a deployed report in the service. This is a workspace on premium capacity(P1) with Fabric enabled.

Copilot has given me a response (it took about 30 seconds) of the margin growth from one year to another.

I then asked it to visualize the output and did not get anything nice.

If you notice, the Preview slider is not enabled, thus giving primitive results. Enable this for better results.

This was a better summary:
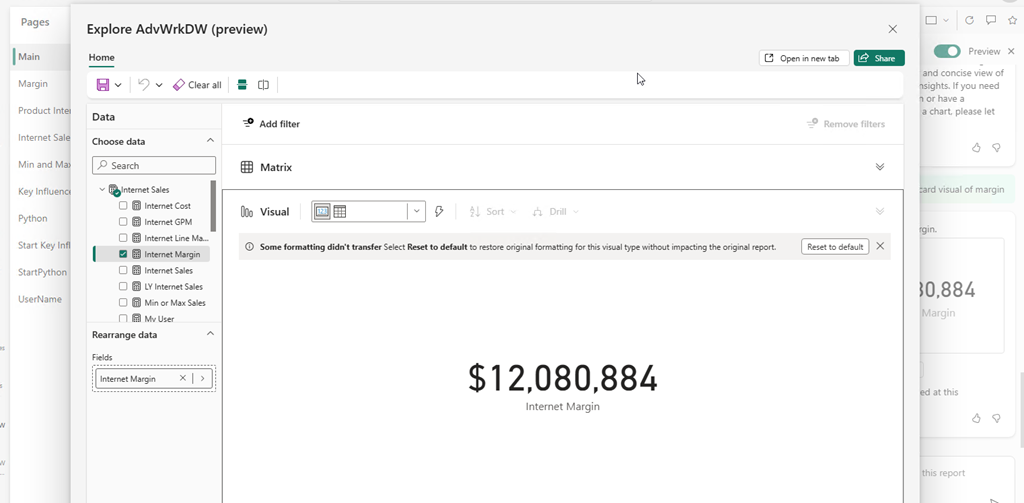
 When I ask for a visual, there is a new option to Explore the visual…
 Now, I can use copilot like Insights from previous versions.


