WOW!!! The next great update to Execution Plans is a way to watch the processing of rows through iterators while the query runs. Never saw that coming. And even a bonus, you can use SQL Server 2016 Management Studio (SSMS) to watch queries run on versions 2014, 2012 and 2008 R2.
SSMS 2016 can be installed by itself without the server installation. Go here for the installation. Once you install SSMS, you can start to view this addition in SSMS.like Figure 1.

Figure 1 – Live Query Statistics
After opening a New Query, go to the Query menu choice and select “Include Live Query Statistics.” You will need a long running query in order to see the processing happening at a slow pace.

Figure 2 – Include Live Query Statistics
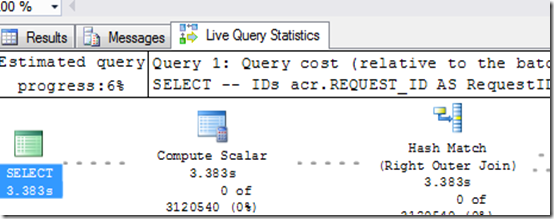
Once you start a query, a new tab will show the Live Query Statistics like Figure 3. The dotted lne means the iterator has not finished or has not started.

Figure 3 – New Tab
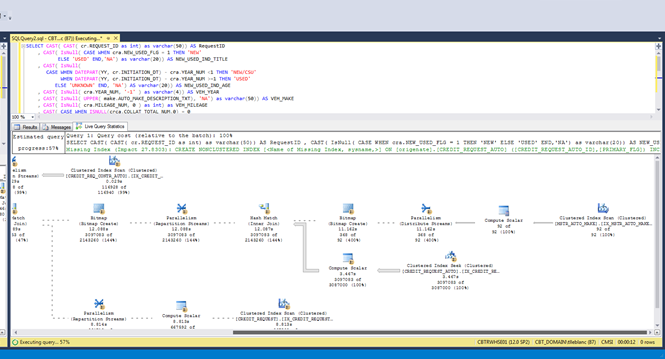
The labeling of the iterators have the usually properties as an Execution Plan plus a running time clock of seconds that this iterator is using. In addition, you can see the “Actual Number of Row” of “Esitmated number of Rows” with a calculated Percent Done (Actual/Estimated). Figure 4 shows 144% for some iterators that have not even finished yet.

Figure 4 – Percent Greater Than 100
This is useful to see if estimate number of rows is the same or close to actual number of rows. The percentage will rise above 100 if there are more actual than estimated rows. The query in this case probably could use some performance tuning to get the estimate closer to the actual.
WOW!!!

