
There are many opportunities for performance tuning in Power BI. The main areas are the data model, visualization pane and the service. Power BI always starts with data. Once the data is modeled, the visualizations can be created. The visualizations include slicers and filters. Finally, a deployed Power BI pbix file to the Power BI Service (app.powerbi.com) concludes the workflow for consumption.

This post will talk about data modeling. Specifically, a flat file versus a dimensional model. If you have not heard the term dimensional model, you might have heard star schema. A star schema is a dimensional model in the form of a data mart. Data marts are reporting areas for a Power BI report.

We see a lot of reports built off an export of data. But, the Power BI data model works best with a dimensional model. That is usually a fact table that has numeric measures and dimension table attributes related to the fact.The relationship between fact and dimension tables are usually thru surrogate keys.

What happens with the export file is the source of the export joins the tables together flattening the attributes of the dimensions with the measures of the fact into one file or view. You can see this in the figure above. It is a view created in SQL Server and shows the data.

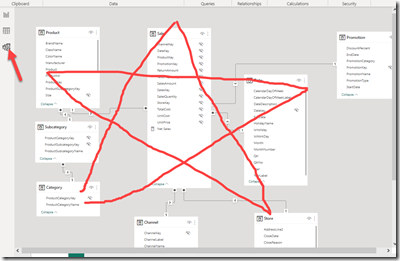
That same data can be imported into Power BI based on the source tables of the view. You get a data model in Power BI like the figure above.

If you take both of these models, one importing the flat data and one importing the individual tables, then can look at the storage size with an external tool. The tool is called DAX Studio and can be downloaded for free from sqlbi.com. The tool has a view metrics function to view the size. Below is the size for the flat data.

To get to the analysis of the size in DAX Studio, you can launch the application from Power BI in the External Tools menu. Then, DAX Studio will open with a connection to the open model from Power BI. Under the Advanced menu, select View Metrics. The figure below shows the size of the data mart model.

The Difference in size is 100MB versus 81 MBs. That is pretty significant. There is more to the analysis in DAX Studio, but we will continue that in the next post.

