In the first blog, a big thank you was given to Microsoft for enabling Power BI in Reporting Services. Lots of shops are still not in Azure with reporting. This option gives on premise companies a way to share Report BI reports within the domain. Report Services has been around for a long time and adding these reports will enable the use of SSRS (now PBIRS) for a long time to come.
Relative Date Slicer
This is a pretty neat tool to use with filters. By selecting Relative Date Filtering for a Page, Report or Drill Down Filter, Power BI gives an option to pick the range relative to a day like last 3 months or last 2 years.

Figure 1 Date Relative Filter
This was a usefull option mentioned in a Power BI workshop I did at SQLSaturday in Dallas May 18th.

Figure 2 In the last 6 years
Report Sync Slicers
The ability to sync a slicer between tabs (or pages) of a Power BI report solves so many questions about filtering. The sync slicer not only filters across multiple tabs, but it gives the option of showing or not showing the slicer on the addition tab (or pages).

Figure 3 Sync Slicers
So now when users do not want to use Power BI because of slicers not filtering other pages, there is no execuse for not using Power BI. Adding this option was the last road block of implementing on premise Power BI we heard from most analyst.
Drill Thru
Drill thru enables one page to be linked (filtered) to another page based on the selected filter of the main page.

Figure 4 Main Page Category Donut
The main page needs to have a visualization with the column the drill thru page will use as a filter.

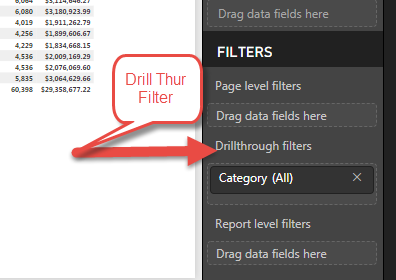
Figure 5 Drill Thru Page (filter)
The drill thru page will need to have a Drillthrough Filter in the Filters section of the page. This enables a right-click menu on the main page.

Figure 6 Right-click Drillthrough
Custom Visualizations
The ability for companies and individuals to add custom visualizations to Power BI reports has to be one of the best features available. The list of custom visualizations grows constantly and it is hard to keep up. Devin Knight has been blogging about these for sometime and I highly suggest watching his blog.

Figure 7 Custom Visualizations
Save to Reporting Services
I mean, come on. What better option to have than being able to use Power BI on-premise. Integrating into Reporting Services makes alot of people happy.

Figure 8 Save to PBIRS
Having Enterprise edition and not paying any additional costs is nice. Keep up with your EA or SA aggrement and no adiditional charges. Sweet!!!

